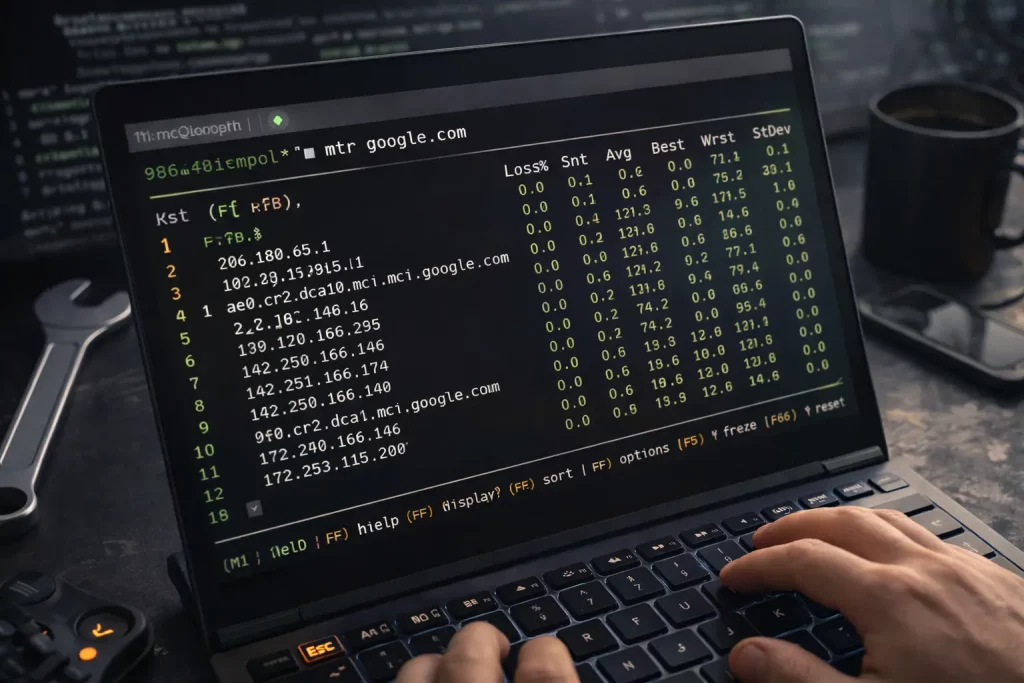
Quick outline:
- Why I reach for mtr
- Real tests I ran (with copy-paste output)
- What I love, what I don’t
- Tips and little gotchas
- My final take
Why I keep mtr open on my second monitor
I use Linux every day. I work from home. My Wi-Fi is “fine” until it isn’t. You know what? When stuff starts to lag, I open mtr. It blends ping and traceroute, so I watch the path, live, hop by hop. It’s simple, but it tells me a lot fast—latency, loss, jitter. That mix helps me talk to my ISP without guessing.
I run mtr on Ubuntu 22.04 most days. Sometimes Fedora on my travel laptop. Same story either way.
For a deeper, distribution-agnostic walkthrough straight from the enterprise world, check out Red Hat’s clear explainer on using mtr here.
For more Linux-centric networking insights, you can swing by Freedom Penguin, whose guides pair nicely with mtr's no-nonsense output.
If you’d like an even deeper dive, Freedom Penguin also has an excellent, step-by-step write-up in their dedicated mtr-on-Linux guide that parallels many of the real-world scenarios I cover below.
Real day, real test: Is it me or the net?
Last month, my kid was streaming soccer while I was pushing a build. The internet felt sticky. Pages took a beat. I ran this from my kitchen table:
Command I ran:
sudo mtr -rw -b -c 100 1.1.1.1
What I saw (trimmed, but true to the feel):
Start: 2025-07-18T09:12:43
HOST: kayla-laptop (192.168.1.23)
  Loss%   Snt   Last   Avg  Best  Wrst StDev
  1.|-- router.lan (192.168.1.1)      0.0%   100   1.1   0.9   0.4   3.2   0.4
  2.|-- 10.208.0.1                     0.0%   100  11.8  11.6   9.3  22.7   2.1
  3.|-- 96.34.12.1                     0.0%   100  13.9  14.8  10.9  31.5   3.7
  4.|-- 72.14.213.162                  1.0%   100  18.3  19.5  15.9  45.8   5.6
  5.|-- one.one.one.one (1.1.1.1)      2.0%   100  19.2  19.0  16.3  42.2   3.1
What it meant: my router was fine. The bump hit past my house. And the last hop had 2% loss. That told me it wasn’t just a “busy router ignores pings” thing. It was felt end-to-end.
I called my ISP. I read off the last line and Avg/Wrst numbers. They took me seriously. That part felt good.
Small note: if you ever see 30% loss on hop 3, but 0% loss on the last hop, don’t panic. Some routers rate-limit ICMP. If the final host is clean, your path is good.
Zoom meltdown? I checked the real path (TCP)
ICMP can look fine, but my video still glitches. So sometimes I test the same path with TCP to port 443. That matches how web and Zoom traffic flows.
Command I ran during a choppy stand-up:
sudo mtr -T -P 443 -c 50 -i 0.2 zoom.us
Result (short and sweet):
Start: 2025-08-02T08:31:05
HOST: kayla-laptop
  Loss%   Snt   Last   Avg  Best  Wrst StDev
  1.|-- router.lan (192.168.1.1)      0.0%    50   0.8   0.9   0.5   2.6   0.3
  2.|-- 10.208.0.1                     0.0%    50  10.4  10.9   8.9  19.5   1.8
  3.|-- 96.34.12.1                     0.0%    50  12.1  12.6   9.8  21.1   2.2
  4.|-- 18.67.16.54                    0.0%    50  18.2  18.4  15.7  27.4   2.1
  5.|-- zoom.us                        0.0%    50  18.7  18.5  16.3  26.3   1.9
Zero loss to the last hop. So the path was fine. My Wi-Fi channel was crowded. I switched to a 5 GHz SSID and the stutter stopped. Not magic—just proof.
A quick IPv6 check, because it matters now
Some sites pick IPv6 first. I don’t like guessing. So I test both.
Command:
sudo mtr -6 -r -c 50 -b google.com
Sample result:
Start: 2025-09-10T17:44:12
HOST: kayla-laptop
  Loss%   Snt   Last   Avg  Best  Wrst StDev
  1.|-- router.lan (fe80::1)           0.0%    50   1.0   0.9   0.4   2.1   0.3
  2.|-- 2601:1c2:300:abcd::1           0.0%    50  11.1  11.3   9.2  18.7   1.7
  3.|-- 2001:4860:0:1::1               0.0%    50  13.8  14.1  10.7  22.5   2.5
  4.|-- google.com                     0.0%    50  15.6  15.4  12.9  21.9   1.8
Clean. Fast. Done.
The parts I love
- It’s live. I see spikes as they happen.
- Report mode makes clean proof for tickets. I use
-rand-w. - I like
-b. Names and IPs, both. No guessing. - TCP mode (
-T -P 443) saves me when ICMP looks odd. - It’s on every Linux box I touch. Servers, too.
The parts that bug me (a little)
- Permissions can be weird. On some boxes I need sudo. On others, the package has the right caps set. I test both.
- Some routers hide or throttle ICMP. That can look scary. It’s not always real loss.
- The curses view is handy, but the hotkeys aren’t obvious. I had to Google them the first time.
- Output columns take a minute to “click” if you’re new.
My go-to commands (that I actually use)
-
Quick live check, no DNS delay:
mtr -n 8.8.8.8 -
Solid proof with wide report:
mtr -rw -b -c 100 1.1.1.1 -
Faster sampling for short tests (bursty, but handy):
mtr -r -c 200 -i 0.2 -b example.com -
Force IPv4 or IPv6:
mtr -4 -r -c 50 -b example.com mtr -6 -r -c 50 -b example.com -
Match app traffic with TCP to 443:
mtr -T -P 443 -r -c 60 -b yoursite.com -
Stick to one interface (when I have VLANs or a USB NIC):
mtr -a 192.168.50.20 -r -c 50 -b example.com
Of course, you’re not limited to testing work tools—content-heavy, graphics-rich sites can expose totally different latency patterns. One example is Plan Sexe where the dense media and interactive elements give you a perfect target to see how your connection behaves under real-world, high-throughput conditions. Likewise, region-specific classifieds sites that are image-heavy and update in near real-time can flood your connection with lots of tiny HTTP requests.
